
|
HENSLOW'S SPARROW HABITAT MODEL |
Two substantially independent lines of reasoning, one deductive and one inductive, were used to develop predictions for prospective Henslow's sparrow (Ammodramus henslowii) habitat (Fig. 1). The intersection of these predictions from different logical approaches was used as the final prediction.
Deductive prediction of Henslow's sparrow habitat at Fort Knox was based on identifying sites which could support dense grass vegetation. Soils identified as potentially suitable to support dense stands of grass included the Mollisols and mollic Alfisols, and a number of Alfisols (Hagerstown, Markland, Beasely, Lowell, Alford, Elk, Wellston, Crider, Sonora, Vertrees, Baxter, Cumberland, Gatton, Nicholson, Otwell, Zanesville, Lawrence, and Sadler). Soils that were too wet (water table too close to the surface or frequently flooded), too dry (shallow), or too eroded were excluded. Severely eroded phases of Baxter and Beasely were also excluded. Pixels with unsuitable land cover were then eliminated as potential Henslow's sparrow habitat. Transitional, barren, maintained grass or lawn grass land cover types were considered potentially suitable.
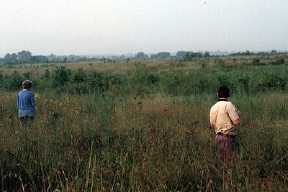
At Fort Knox, where Henslow's sparrow is a Kentucky state-listed species of special concern, grasslands near the Goodman Army Airfield are managed as a protected area for a breeding population of these birds. A 100 m radius circle containing this nesting population (centered at 590200E, 4196500N UTM meters, Zone 16) was used to inductively identify areas with similar spectral characteristics elsewhere within the reservation. Because a single habitat class is not sufficient for discriminating a binary habitat map, the maximum likelihood classification algorithm was run with the single signature on the raw LANDSAT TM spectral data, and a Chi-squared test was performed on each discriminant result at every cell. The reject threshold map that resulted contained the confidence level at which each cell in the map was classified. Cells that had less than a 5% probability of being correctly assigned to the Henslow's sparrow habitat class were defined as not being Henslow's sparrow habitat. A spectral signature was developed for these non- habitat cells, and the maximum likelihood classification was repeated to produce a binary habitat prediction. Because the nesting habitat is believed to be limiting for this species (Zimmerman 1988), we used the intersection of the deductive and inductive layers as the predicted habitat map.
For further information contact Bill Hargrove or Tom Ashwood
Zimmerman, J. L. 1988. Breeding season habitat selection by the Henslow's sparrow (Ammodramus henslowii) in Kansas. Wilson Bull. 100:17-24