
|
TERRITORIAL MIGRANT POPULATION MODEL |
The territorial migrant model [right click to download, left click to view] addresses population demographics of bird species that are migratory and establish breeding territories. Two instances of the model have been parameterized: cerulean warblers on the Department of Energy's Oak Ridge Reservation (Tennessee) and Henslow's sparrows at both Fort Knox (Kentucky) and Fort Riley (Kansas). This page presents a brief description of the two bird species and a more detailed description of the model. For further information contact Tony King or Tom Ashwood
Henslow's sparrow is associated with dense, tall grasslands (including hay fields) which are not mowed or burned annually (Skinner et al. 1984; Zimmerman 1988; Rising 1996). Henslow's sparrow breeds in north central eastern United States from South Dakota (east of the Missouri River) and eastern Kansas to New York, Virginia, and eastern or coastal North Carolina. The northern limit of its range is in central Minnesota, upper-peninsular Michigan, and southern Ontario (Beyers et al. 1995; Rising 1996). Northern Kentucky and Fort Knox are on the southern edge of the species' breeding range. Listed by the Kentucky State Nature Preserves Commission as a species of special concern, the largest documented summer population in Kentucky is found at Fort Knox. The species is considered a short to medium distance migrant, wintering in the coastal plain of the southeastern United States.
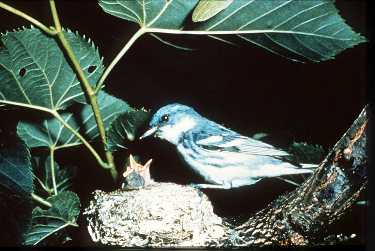
Cerulean warblers nest in extensive tracts of mature deciduous forests (Bent 1953; Robbins et al. 1989; Hamel 1992). Their breeding range extends from central New York, southern Ontario, southern Michigan, southeastern Minnesota, and Southeastern North Dakota to the northern portions of the gulf coast states, primarily west of the Appalachians (Peterson 1947). The species is a long distance migrant, wintering in South America.
Consider a landscape of several thousand hectares in the breeding range of a migratory bird species. The species is monogamous on the breeding grounds, and mated pairs establish and defend all-inclusive Type A territories, within which nesting and most foraging takes place (Hinde 1986, Morse 1980). The landscape is mapped with a regular grid of square cells. Habitat used for nesting is distinguished from non-nesting habitat. Cells of nesting habitat separated by less than the distance the pair will readily cross in using and defending their territory are aggregated into patches. Vegetation or landcover within a patch is perceived as contiguous homogeneous nesting habitat. The matrix between patches is not used for nesting.
Patches of nesting habitat smaller than the species' territory size are not used for nesting. Patches larger than this minimum size are filled with territories (equivalently: nests, breeding pairs, or breeding females) according to an incidence function J(A) (Wilcove et al. 1986), which describes the probability of encountering a breeding pair (or territory) at a random point in a patch of area A {Robbins et al. 1989). Incidence is calculated with a logistic regression model
 | (1) |
where ß0, ß1, and ß2 are model (regression) parameters. The probability of occurrence JA is interpreted as the proportion of the patch occupied, and the number of nests N in patch nests i is the occupied area divided by territory size, or:
 | (2) |
where AT is territory size (ha), and Ni is rounded to the nearest integer. The maximum number of nests in a patch is patch area divided by territory size and occurs when JA = 1.0.
Each nest in each patch produces a clutch of eggs. Clutch size C for each nest is drawn independently from a species- or population-specific frequency distribution. The clutch size of some species is uniformly distributed between a minimum and maximum; others have a model clutch size. Consequently, clutch size may vary among nests.
Nesting success, the probability that a nest will produce at least one fledgling (Johnson and Temple 1986), is a function of a patch's edge:area ratio. Reflecting the assumption that higher rates of nest predation and parasitism are associated with increased amounts of edge, and edge has a negative effect on nesting success, nesting success is lower in patches with a large edge:area ratio (i.e., those patches withlots of edge per unit area). Maximum nest success occurs in large patches with relatively little edge. The edge:area ratio is normalized by the edge:area ratio of a single square cell, yielding an edge:area index with a maximum value of 1.0 indicating maximum edge per unit area. A value near 0.0 indicates a patch with minimal edge per unit area. The probability of nesting success in patch i, Si, is given by
 | (3) |
where Smax is the maximum probability of nesting success for patches with an edge:area ratio approaching zero, or, equivalently, nesting success in the absence of any edge effect, and ei is the normalized edge:area index of patch i. The parameter k is the value of ei where Si = 0.5 Smax, and theta is a parameter which determines the rate at which nesting success declines with larger edge:area ratios.
Nesting success in the absence of any edge effect, Smax, will be less than one; some nests will be lost to predation, storms, or other factors, regardless of their proximity to an edge. The probability of nesting success will be less than one even in the largest most contiguous patch of habitat. Some species will be relatively insensitive to edge, at least until patches become mostly edge (i.e., the edge:area index approaches 1). We refer to this pattern as a Type I edge response. Other species will be very sensitive to edge, and the probability of nesting success will decline very rapidly with an increasing edge:area ratio. Others will show an intermediate response of more gradual decline with increasing edge per unit area. Calibration of the parameters Smax, k, and theta will fit the nesting success curve of Eq. 3 to any observed or hypothesized response to edge within this family of response curves.
Nesting success in the model is evaluated stochastically for each nest in a patch. The probability that a nest in patch i fledges no young is 1 - Si. Nests which fledge at least one young are assumed to fledge the entire clutch, so Fji, the number of fledglings from nest j in patch i, is Cji (the clutch size of that nest) for successful nests and 0.0 for unsuccessful nests.
The sex of each fledgling is determined stochastically according to the population's fledgling female:male sex ratio. Thus, it is possible for a nest to produce only male or only female fledglings, but cumulatively, across all nests in the landscape, the ratio of female to male fledglings will approach the population's or species' fledgling sex ratio (normally assumed to be 1:1 or 50% females).
Productivity, the number of fledglings (of both sexes) per nest (or territory or pair), is
 | (4) |
for each patch, where Fji is the number of fledglings in nest j of patch i. Productivity can vary from patch to patch, primarily as a consequence of patch variability in the probability of nesting success, itself a consequence of variability in edge:area among patches. Thus the model reflects variability in patch "quality" and contribution to population dynamics (Pulliam and Danielson 1991), but only that associated with patch size and shape. Productivity for the entire landscape or population, PL, (not the mean of patch productivity) is
 | (5) |
where m is the number of patches. Note that these estimates of productivity incorporate reductions in productivity due to nest failure. The (higher) expected productivity of successful pairs (or nests) is the mean clutch size.
The demographic parameter b, the expected number of female fledglings produced per female, is
 | (6) |
where FjiY is the number of female fledglings in nest j of patch i, and Na is the total number of adult reproductive females in the landscape population. In determining b, the model assumes that the number of adult females is equivalent to number of territories (i.e., nests or mated pairs) so  . Note that this assumption results in a maximum value for b for a landscape with nesting habitat fully occupied by mated pairs. The presence of non-mated non-nesting females would reduce b.
The model assumes productivity is independent of age after sexual maturity. The maternity function mx, the number of female fledlings produced by a female of age x, is then mx = b for all ages x.
The maternity function is combined with age-specific survivorship to create a life table for the landscape's population (Leslie 1966, Mertz 1971, Nichols et al 1980, Lande 1988, Noon and Biles 1990) (Table 1). Annual survival probabilities are defined for three age classes: juveniles s0, subadults s1, and adults s.
Two demographic indices are calculated from the life table. The first is net lifetime maternity or net reproductive rate:
 | (7) |
where R0 is the expected lifetime production of females by a female fledgling, and lx is the probability of survivorship to age x from the life history table. For a stable age distribution, when R0 = 1.0, a female replaces herself in her lifetime, and the population is stable. If R0 < 1.0 the population is declining, and if R0 > 1.0$ the population is increasing.
The second demographic index is the finite rate of increase lambda given by the solution of the characteristic equation (Noon and Biles 1990):
 | (8) |
where T > 1 is the age of sexual maturity and 0 < s < 1. If lambda = 1.0 the population is stable. When lambda < 1.0 the population is declining, and if lambda > 1.0 the population is increasing. The annual rate of change of the population size (% year-1) is (lambda - 1.0) × 100.
In addition, the life table parameterizes an age classified matrix population model (Caswell 1989). This Leslie matrix is used to project population numbers forward in time.
Bent, A. C. 1953. Dendroica cerulea. pp. 329-337 In A. C. Bent. Life Histories of North American Wood Warblers. U.S. Natl. Mus. Bull. 237.
Beyers, C., J. Cursor, and U. Olsson. 1995. Sparrows and buntings. Houghton-Mifflin, Boston, Massachusetts.
Caswell, H. 1989. Matrix population models. Sinauer Associates, Inc., Sunderland, Mass.
Hamel, P. B. 1992. Land manager's guide to the birds of the South. The Nature Conservancy, Southeastern Region, Chapel Hill, North Carolina.
Hinde, R. A. 1956. The biological significance of the territories of birds. Ibis 98:340-369.
Johnson, R. G., and S. A. Temple. 1986. Assessing habitat quality for birds nesting in fragmented tallgrass prairies. pp. 245-249 In J. Verner, M. L. Morrison, and C. J. Ralph (eds.) Modeling Habitat Relationships of Terrestrial Vertebrates. The University of Wisconsin Press, Madison, Wisc.
Lande, R. 1988. Demographic models of the northern spotted owl (Strix occidentalis caurina). Oecologia 75:601-607
Leslie, P. H. 1966. The intrinsic rate of increase and the overlap of successive genereations in a population of guillemots (Uria aalge Pont.). J. Anim. Ecol. 35:291-301.
Mertz, D. B. 1971. The mathematical demography of the California condor population. Am. Nat. 105:437-453.
Morse, D. H. 1980. Behavioral mechanisms in ecology. Harvard University Press, Cambridge, Mass.
Nichols, J. D., G. L. Hensler, and P. W. Sykes, Jr. 1980. Demography of the everglade kite: Implications for population management. Ecolog. Model. 9:215-232.
Noon, B. R., and C. M. Biles. 1990. Mathematical demography of spottted owls in the Pacific Northwest. J. Wildl. Manage. 54:18-27.
Peterson, R. T. 1947. A field guide to the birds. Houghton-Mifflin, Boston, Massachusetts.
Pulliam, H. R., and B. J. Danielson. 1991. Sources, sinks, and habitat selection: A landscape perspective on population dynamics. Am. Nat. 137:S50-S66.
Rising, J. D. 1996. A guide to the identification and natural history of the sparrows of the United States and Canada. Academic Press, San Diego, California.
Robbins, C. S., D. K. Dawson, and B. A. Dowell. 1989. Habitat area requirements of breeding forest birds of the middle Atlantic states. Wildl. Monogr. 103:1-34.
Skinner, R. M., T. S. Baskett, and M. D. Blenden. 1984. Bird habitat on Missouri prairies. Terr. Ser. 14, Missouri Department of Conservation, Jefferson City, Missouri.
Wilcove, D. S., C. H. McLellan, and A. P. Dobson. 1986. Habitat fragmentation in the temperate zone. pp. 237-256 In M. E. Soulé,(ed.) Conservation Biology: The Science of Scarcity and Diversity. Sinauer Associates, Inc., Sunderland, Mass.
Zimmerman, J. L. 1988. Breeding season habitat selection by the Henslow's sparrow (Ammodramus henslowii) in Kansas. Wilson Bull. 100:17-24.
Return to The Model section of this page