
Data
Data files describing CO2 concentrations, meteorlogical conditions, and ecosystem responses are posted through the FACE Data Management System maintained by the Carbon Dioxide Information and Analysis Center. We hope this will make our data more accessible to users worldwide and to facilitate cross-site synthesis research and modeling activities.
Data files and associated documentation files and citations include:
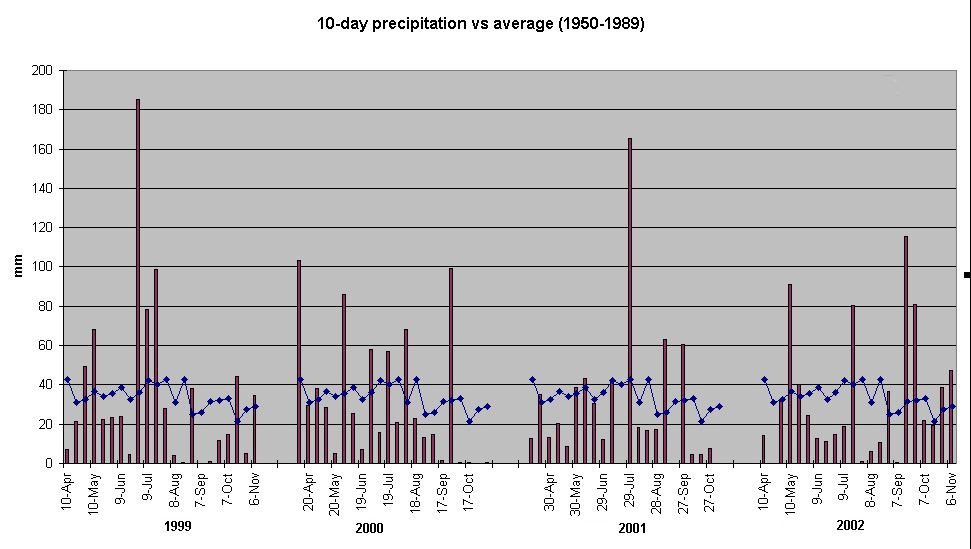
Hourly and daily weather data, 1999-current, including air and soil temperatures, precipitation, humidity, PAR, and wind
Daily leaf-air index, 1999-2005
Basal area increment of each tree, monthly, 1997-2006
**********************************************************
The data sets below will migrate to the CDIAC site after thorough QA/QC and formatting.
Soil Moisture
Soil moisture measured at 0-20 cm depth by TDR
Soil Moisture, 1997-2003
Soil Moisture, 2004-2006
click on graph to enlarge
Fine root dynamics
Fine root production, mortality, and standing crop were calculated from minirhizotron images collected every 2 weeks (except in winter) from 1998 through 2006.
Leaf area index
Leaf area index (LAI, total one-sided leaf area above a unit of ground area)
was calculated for each plot for every day of the growing season.
Leaf area production in the spring was calculated from the fractional
transmittance of PAR (T), which was calculated from daily total PAR above
and below the canopy. A curve was fit to ln(T)/-k data, where
the extinction coefficient k was set such that maximum leaf area
production at budset (early to mid July) was equal to that determined
from litter basket collections. A canopy-averaged value of leaf mass per
unit leaf area was used to convert abscised leaf mass in litter baskets to
green leaf area. A curve was fit through litter basket
data to generate cumulative daily leaf area loss, which was subtracted
from the leaf area production curve to generate daily LAI.